Ce document n'est pas traduit, désolé...
Climatology of Global Stratospheric Ozone
Image(s): 640*480
 Jpeg Image (41 Ko)
|
 Jpeg Image (41 Ko)
|
Author(s)
-
Treinish Lloyd
- Email :
Institute(s)
-
IBM T.J. Watson Research Center
Video(s) and extracted images: 320*240
|
Film
1 |
Video QuickTime -> |
|
|---|---|---|
| Jpeg Images -> |
 (13 Ko)
|
|
Film
2 |
Video QuickTime -> |
|
|---|---|---|
| Jpeg Images -> |
 (13 Ko)
|
Description
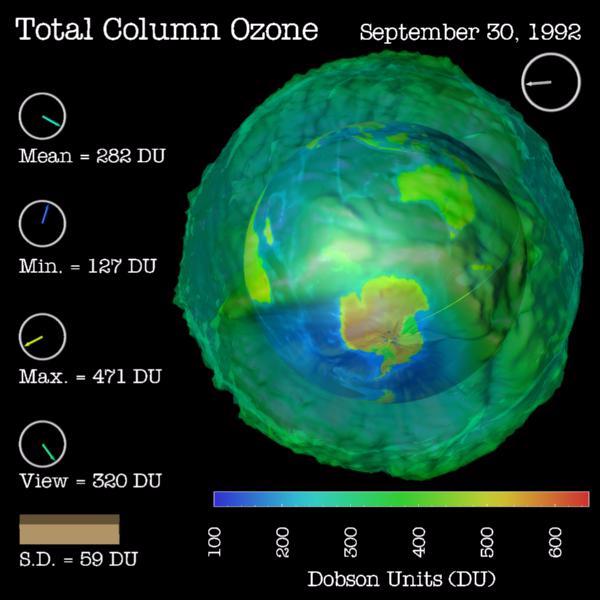
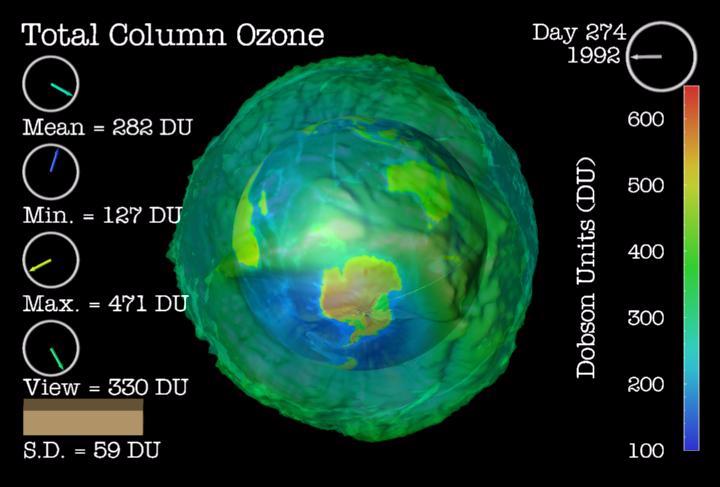
Long term evolution of global atmospheric phenomena can be illustrated via qualitative presentation in a physically appropriate coordinate system. A technique to visualize global scalar, two-dimensional fields is developed, which triply redundantly maps the data to color, opacity and height and warping the resultant surface around a globe.
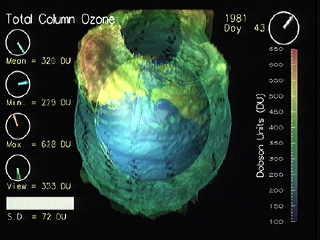
The method is applied to global total column ozone such that high ozone values appear thick, far from the earth and reddish while low ozone values are thin, close to the earth and bluish. The globe in the center of this ozone surface is created from 30-minute topography data.
The topography is warped onto a smooth, Gouraud-shaded opaque sphere (i.e., 259,200 polygons) and pseudo-colored to give the appearance of a globe by having all values around sea level and below appear light blue. The topography and ozone data are registered in a common spherical, earth- centered coordinate system. The spherical object gives the appearance of looking at a continuous phenomenon. The use of three redundant realization techniques results in patterns or textures, which are particularly effective in animation of time sequences for qualitatively identifying regions of spatial or temporal interest in the data. Such an approach shows promise for data browsing.
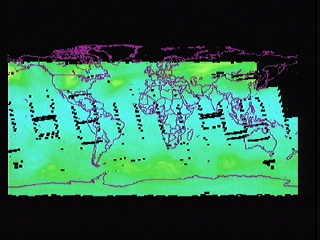
This idea is applied to thirteen years of daily observations by the Total Ozone Mapping Spectrometer (TOMS) on board NASA's Nimbus-7 spacecraft of the earth's ozone layer from January 1, 1979 through December 31, 1991. The resulting animation illustrates the dynamics of stratospheric ozone and the morphology of seasonal, Antarctic ozone depletion. All of the data are available courtesy of the National Space Science Data Center at NASA/Goddard Space Flight Center, Greenbelt, MD.
-
Date : 29:11:95
-
Category : Simulation
-
Keys Words :
- visualization
- ozone
- ozone depletion
- atmospheric dynamics
- cartography
-
Theme(s) :
Technical Information
IBM Visualization Data Explorer software was used to design and generate the animation. Digital video production was done on an IBM POWER Visualization System.More Information...
-
Some external links :